| You're probably missing out on recent gains from non | 您所在的位置:网站首页 › out of stock › You're probably missing out on recent gains from non |
You're probably missing out on recent gains from non
|
I base these projections on the relative CAPE ratios of countries’ stock markets. The CAPE is the cyclically-adjusted P/E ratio that was made famous by Yale University professor Robert Shiller. It’s similar to the better-known P/E ratio, except the denominator focuses on 10-year average inflation-adjusted earnings rather than trailing 12-month earnings. The chart below plots the latest CAPE ratios for two dozen developed countries, courtesy of data from Barclays Bank. Notice that the U.S. CAPE ratio is the second- highest, eclipsed only by that of the Netherlands. 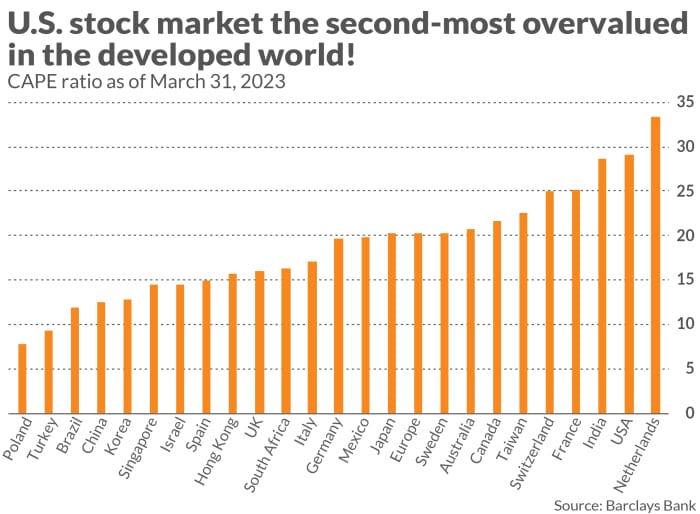
Few investors use the CAPE ratio to allocate their stock portfolios between different countries. The ratio is most often applied to the S&P 500 SPX, -0.00%, and in that context the ratio has fallen into disfavor. For many years now CAPE has been well above its long-term U.S. average, and many critics have concluded that comparing recent readings to those from long-ago decades is comparing apples to oranges. But a comparison of different countries’ current CAPE ratios sidesteps this criticism. In this case, we’re not comparing CAPE ratios across time but between countries. There’s considerable research suggesting that the ratio can play a valuable role in allocating an equity portfolio between countries and regions. A review of this research appeared a couple of years ago in the Journal of Risk and Financial Management. The studies cited in that review reported that the CAPE ratio historically has explained between 50% and 80% of the variation in developed countries’ 10-year returns. That’s a far-better track record than for the vast majority of indicators popular on Wall Street, which are able to explain less than 10% of the variation — if any at all. Down on the U.S. dollarThere’s another reason U.S.-based investors may want to overweight their equity portfolio’s allocation to non-U.S. stocks: a weaker U.S. dollar DX00, -0.06%. A declining greenback means that the local-currency-denominated profits of a non-U.S. company translate into a larger profit to a U.S.-based investor. An increasing number of analysts believe that the dollar’s major trend has turned lower. It’s been many years since U.S. investors were able to benefit from a falling dollar. From its low in 2008, the U.S. Dollar Index DXY, -0.41% rose more than 60% to its high in the fall of 2022, during which U.S. stocks significantly outperformed non-U.S. stocks. Since then the dollar has declined more than 10%, and returns of non-U.S. stocks have soared relative to U.S. stocks. For example, the iShares MSCI ACWI ex US ETF ACWX, +0.39% has gained 21.0%, more than doubling the 10.3% gain of the U.S.-specific Vanguard Total Stock Market ETF VTI, +0.10%. (Data from FactSet.) Mark Hulbert is a regular contributor to MarketWatch. His Hulbert Ratings tracks investment newsletters that pay a flat fee to be audited. He can be reached at [email protected] More: How the dollar’s decline could add to inflation problems Also read: It’s the right time to invest overseas. Here are the best funds to do it. |
【本文地址】